In this study, I am analyzing student enrolment in high education institutions in Alberta for a 10 year period, 2012 – 2022.
Active post-secondary education students: 2012 – 2022
Summary Statistics:
The following table shows summary statistics on enrolment in all Alberta post-secondary institutions:
| Row Labels | Active Students |
| 2012-2013 | 550492 |
| 2013-2014 | 536294 |
| 2014-2015 | 536028 |
| 2015-2016 | 538408 |
| 2016-2017 | 538832 |
| 2017-2018 | 535888 |
| 2018-2019 | 546704 |
| 2019-2020 | 538410 |
| 2020-2021 | 543944 |
| 2021-2022 | 547768 |
Note: This data includes part-time and full-time students that each university considers active students. Their definition of an active student might differ.
Outcome of Analysis
Year of year, enrollment has not changed significantly over the last ten years.
Active post-secondary education students by type of educational institution: 2012 – 2022
Let’s look at the data by the type of institution. The following table shows enrollment by academic year and type of educational institution.
Summary statistics
asdfd
| Row Labels | 2012-2013 | 2013-2014 | 2014-2015 | 2015-2016 | 2016-2017 | 2017-2018 | 2018-2019 | 2019-2020 | 2020-2021 | 2021-2022 | Grand Total |
| Comprehensive Academic and Research Universities | 251174 | 250314 | 243476 | 242520 | 246774 | 250132 | 258310 | 262568 | 269050 | 266500 | 2540818 |
| Comprehensive Community Colleges | 99780 | 87076 | 90426 | 91804 | 92484 | 93556 | 97288 | 95162 | 91040 | 94416 | 933032 |
| Independent Academic Institutions | 8356 | 8400 | 8886 | 9622 | 10258 | 10748 | 11424 | 12918 | 12956 | 12638 | 106206 |
| Polytechnic Institution | 120700 | 120560 | 124094 | 126288 | 121198 | 111940 | 110424 | 98600 | 101414 | 103732 | 1138950 |
| Undergraduate Universities | 70482 | 69944 | 69146 | 68174 | 68118 | 69512 | 69258 | 69162 | 69484 | 70482 | 693762 |
| Grand Total | 550492 | 536294 | 536028 | 538408 | 538832 | 535888 | 546704 | 538410 | 543944 | 547768 | 5412768 |
Enrollment Trend:

The following graph shows the percentage of students enrolled in different institution types.
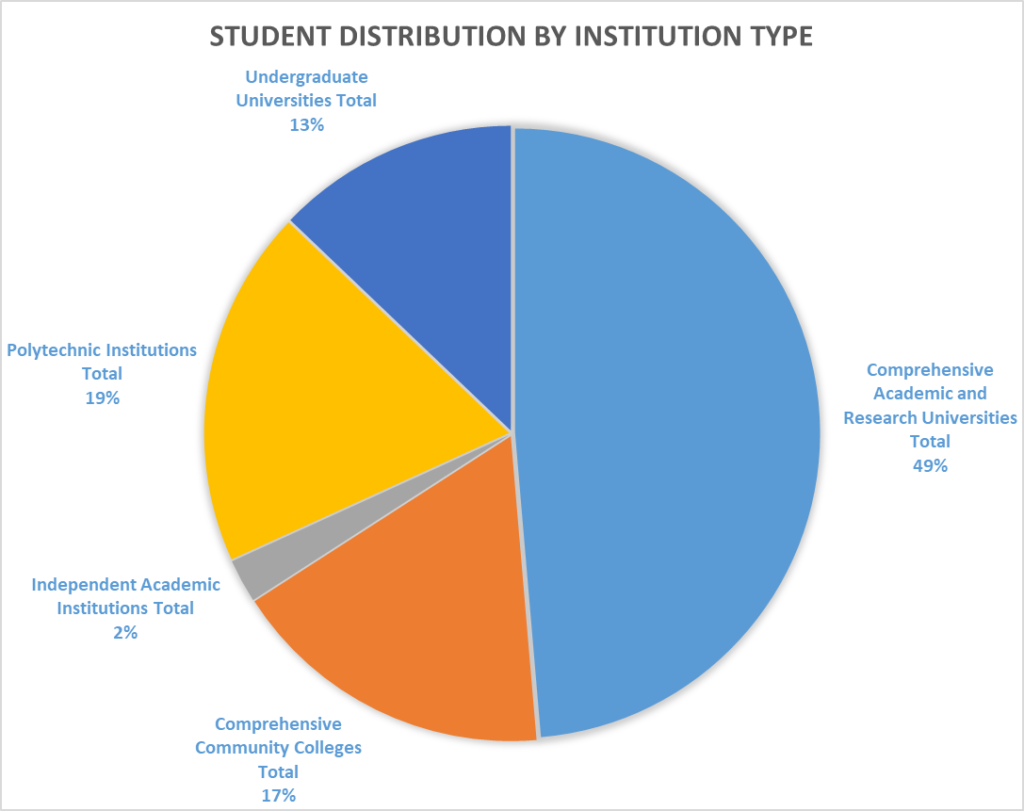
dsfsddsd
Data Dictionary:
Comprehensive Academic and Research Universities
- offer degree programs and conduct research and innovation
- provide approved undergraduate and graduate degree programs
- may offer approved diploma and certificate programs
Undergraduate Universities
- provide approved undergraduate degree programming
- may offer approved foundational learning diploma or certificate programs
- not permitted to offer graduate-level programs
- may undertake research and scholarly activity that enriches undergraduate education
Polytechnic Institutions
- provide approved apprenticeship, diploma, and certificate programs
- may offer approved foundational learning and undergraduate degree programs
- not permitted to offer graduate-level programs
- may undertake research and scholarly activity in alignment with credentials offered
Comprehensive Community Colleges
- provide a broad range of programming to meet the diverse needs of their communities in all regions of the province. These institutions must provide approved foundational learning programs, as well as diploma and certificate programs. They may provide apprenticeship programming where demand warrants, as well as undergraduate degree programming primarily in collaboration with a degree granting institution, or autonomously under particular conditions and subject to Ministerial approval.
Comprehensive Community Colleges
- not permitted to offer graduate-level programs
- may undertake research and scholarly activity
Independent Academic Institutions
- may provide foundational learning, diploma, certificate, and approved undergraduate degree programs
- may provide graduate-level programs in niche areas under particular conditions undergraduate diploma and certificate programs may be either ministry-approved or board-approved.
- may undertake research and scholarly activity in alignment with the credentials offered
- may collaborate with other institutions and sectors to support regional access to undergraduate degree programs
Part Time vs Full Time studies
text text
| Academic Year | Full-Time | Part-Time | Total | % Full-Time | % Part-Time |
| 2012-2013 | 394104 | 429078 | 823182 | 48% | 52% |
| 2013-2014 | 391955 | 409756 | 801711 | 49% | 51% |
| 2014-2015 | 392629 | 409103 | 801732 | 49% | 51% |
| 2015-2016 | 403061 | 402343 | 805404 | 50% | 50% |
| 2016-2017 | 418075 | 388382 | 806457 | 52% | 48% |
| 2017-2018 | 430548 | 371651 | 802199 | 54% | 46% |
| 2018-2019 | 443473 | 375145 | 818618 | 54% | 46% |
| 2019-2020 | 455223 | 351006 | 806229 | 56% | 44% |
| 2020-2021 | 457417 | 357595 | 815012 | 56% | 44% |
| 2021-2022 | 469022 | 350933 | 819955 | 57% | 43% |
| Total | 4255507 | 3844992 | 8100499 | 53% | 47% |
asfdf

text text
Steady trend toward more full-time students than part-time students.